Home → Air Quality → Meteorology Home → Permit Air Quality Modeling Guidelines → Background Data
Background Air Quality
A demonstration of compliance with ambient air quality standards must account for background air quality levels. Background air quality means ambient levels of pollutants not associated with any of the sources explicitly included in the modeling analysis.
Background levels are established for each regulated pollutant and averaging period being assessed. These values are added to modeled impacts to obtain total impacts, which are then compared with applicable ambient air quality standards.
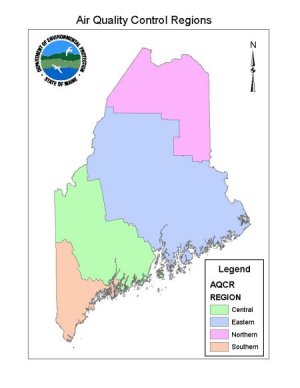
Conservative rural and urban background values are available for all four Air Quality Control Regions (AQCR) of the state:
In addition, the applicant may propose background values determined from a database(s) collected at a monitoring site considered to be representative of a topographic, geographic, and/or demographic setting similar to that of the applicant's impact areas.
One should recognize that more refined data analysis may have to be conducted if the data contained in this table does not permit an attainment demonstration based on modeling. If this proves to be the case, appropriate raw data should be obtained from MEDEP - Field Services Division for the pollutant in question. These data can then be more thoroughly reviewed and a more refined background data determination made.
General guidance on determining background determinations based on monitoring data is provided in the most recent version of the Guideline Document For Background Air Quality Determinations (MEDEP-BAQ, 1993). Prior approval from the MEDEP-BAQ is required for this method and will be granted on a case-by-case basis.
The tables that follows lists the background data values by region on a pollutant/averaging period basis. The data presented here is typically considered to be conservative. Many of the data values for a given region were obtained from a monitoring station outside of the region, as not all regions of the state have (or had) monitoring stations for the necessary parameters. Consequently, the listed data value for a given parameter in a particular region may not be truly representative of the background air quality for that region. In those instances where data could not be obtained from within a region, an alternative sampling site was chosen based on community size and the character of the sources impacting the alternative site being relatively similar to the region of interest.
Rural Background Data Values
|
Pollutant |
Southern Maine |
Central Maine |
Eastern Maine |
Northern Maine |
|
SO2 |
|
|||
1-Hour |
241 |
241 |
241 |
241 |
1-Hour |
- |
- |
102 |
- |
|
3-Hour |
183 |
183 |
183 |
183 |
|
24-Hour |
113 |
113 |
113 |
113 |
|
Annual |
13 |
13 |
13 |
13 |
|
PM10 |
|
|||
|
24-Hour |
414
|
475
|
426
|
327
|
|
Annual |
94
|
115
|
106
|
127
|
| PM2.5 | ||||
|
24-Hour |
178
|
178
|
178
|
178
|
|
Annual |
58
|
58
|
58
|
58
|
|
CO |
|
|||
|
1-Hour |
3659 |
3659 |
3659 |
3659 |
|
8-Hour |
3229 |
3229 |
3229 |
3229 |
|
NOx |
|
|||
1-Hour |
4310 |
4310 |
4310 |
4310 |
|
Annual |
411 |
411 |
411 |
411 |
All units are in µg/m3
KEY:
1. MicMac Site - Presque Isle 2009-2011 design value, averaged over the three-year period
2. MacFarland Hill - Acadia National Park (Site #23-009-0103) - To be used for Downeast Coastal Maine only
3. MacFarland Hill - Acadia National Park (Site #23-009-0103)
4. Upper Ridge Road Site - Bridgton, 2003 data
5. Jay Hill/Bomaster Site - Androscoggin River Valley, 2003-2004 data
6. Background Site - Baileyville (Site #23-029-0020), 1994 data
7. Skyway Industrial Park Site - Presque Isle (Site #23-003-1008), 2004-2007 data
8. Greenville Site - Greenville, 2008-2010 design value, averaged over the three-year period
9. MacFarland Hill - Acadia National Park (Site #23-009-0103), 2011/2012 data
10. MicMac Site - Presque Isle (Site #23-003-1100), July 2009 - June 2012 data, design value for rural NO2
11. MicMac Site - Presque Isle (Site #23-003-1100), 2010-2012 data
Urban Background Data Values
|
Pollutant |
Southern Maine |
Central Maine |
Eastern Maine |
Northern Maine |
|
SO2 |
|
|||
1-Hour |
581 |
581 |
581 |
581 |
|
3-Hour |
732 |
633 |
633 |
694 |
|
24-Hour |
442 |
293 |
293 |
294 |
|
Annual |
102 |
93 |
93 |
54 |
|
PM10 |
|
|||
|
24-Hour |
465 |
513 |
636 |
757 |
|
Annual |
245 |
213 |
216 |
177 |
| PM2.5 | ||||
|
24-Hour |
228 |
228 |
228 |
228 |
|
Annual |
7.58 |
7.58 |
7.58 |
7.58 |
|
CO |
|
|||
|
1-Hour |
17259 |
17259 |
17259 |
17259 |
|
8-Hour |
13809 |
13809 |
13809 |
13809 |
|
NOx |
|
|||
1-Hour |
8210 |
8210 |
8210 |
8210 |
|
Annual |
1711 |
1711 |
1711 |
1711 |
All units are in µg/m3
KEY:
1. EMPACT Site - Portland (Site #23-005-0027), 2009-2011 data, design value for urban SO2
2. EMPACT Site - Portland (Site #23-005-0027), 2003-2006 data
3. CKP Site - Lewiston (Site #23-001-0011), 2011 data
4. Richardson Site - Easton (Site #23-003-1018), 2003-2005 data
5. EMPACT Site - Portland (Site #23-005-0027), 2003 data
6. Bangor KPS Site (Site #23-019-0002), 2003-2004 data
7. Riverside Site - Presque Isle (Site #23-003-1011), 2006 data
8. CKP Site - Lewiston (Site #23-001-0011), 2009-2011 design value, averaged over the three-year period
9. EMPACT Site - Portland (Site # 23-005-0027, 2011 data
10. EMPACT Site - Portland (Site # 23-005-0027), 2010-2012 data, design value for urban NO2
11. EMPACT Site - Portland (Site # 23-005-0027), 2011 data