DACF Home → Bureaus & Programs → Maine Geological Survey → Maps, Publications and Online Data → Using Geologic Maps → Reading Coastal Bluffs Maps
Reading Coastal Bluffs 1:24,000-scale Maps
What's on the maps?
A coastal bluffs map shows the shoreline type and relative stability of bluffs along a section of the Maine coast. The slope, shape, and amount of vegetation covering a coastal bluff and the adjacent shoreline are directly related to the susceptibility of the bluff face to ongoing erosion. A coastal bluffs map describes the processes and stability of the face of a bluff. A companion map, coastal landslide hazards, describes the internal stability of sediment bluffs and their potential to rapidly move large amounts of land downslope under the influence of gravity.
Uses of the maps
This map can help identify shorelines with increased risk of coastal erosion. Bluff erosion can result in a landward shift of the top edge of the bluff. This shoreline change is a natural process that, by itself, is not a coastal hazard. Only when erosion threatens something of value, such as a building near the bluff edge, does bluff retreat become a hazard. Understanding local erosion rates can help determine the severity, and perhaps longevity, of coastal development along a bluff edge. If coastal development is near any bluff we recommend a professional evaluation be made to determine the risk to structures. Municipalities may use coastal bluff maps for determining safe setbacks for new development based on Shoreland Zoning ordinances. The Shoreland Zoning program and model ordinance are administered by the Department of Environmental Protection. Check with your municipal government to determine if a shoreland zoning setback from bluffs applies in your location.
Definitions
Understanding the following terms will help you interpret what you see on a coastal bluffs map.
What is a coastal bluff?
On this map, a bluff is defined as a steep shoreline slope formed in sediment (loose material such as clay, sand, and gravel) that has three feet or more of vertical elevation just above the high tide line. Cliffs or slopes in bedrock (ledge) surfaces are not bluffs and are not subject to significant erosion in a century or more. Beaches and dunes do not form bluffs, except along the seaward dune edge as a result of erosion.
Where is the bluff face?
The bluff face is the sloping land surface at the edge of a bluff (see Figure 1).
Figure 1. Cross section of a coastal bluff showing the location of the bluff face.
What is bluff erosion?
Erosion is the loss of land due to physical processes such as movement of sediment by waves, coastal flooding, or alongshore currents. Bluff erosion can lead to significant loss of land to the sea. Bluff erosion takes place from the top of the bluff down to the sea. Several processes can lead to erosion on bluffs. Groundwater can leak out the face of a bluff to create wet areas that wash sediments down the bluff face. Surface water may flow directly over the face of a bluff or down a gully on a bluff and carry soil and sediment to the sea. Seasonal feeze-thaw cycles can loosen sediment in a bluff that slumps downhill in the spring. At the base of the bluff, high tides, coastal flooding and wave action can scour the bluff toe to remove sediment and undercut the slope. Oversteepened slopes can move downward under the pull of gravity. Coastal bluffs can be affected by all of these processes to some extent. The rate of bluff erosion may vary from one location to the next. Over time, erosion is often episodic with significant land loss one year and less the next. Bluff erosion leads to net land loss and the landward migration of the shoreline as well as the top of the bluff. Actively eroding bluffs are unstable and potentially unsafe for development near the bluff top.
Tips for Reading the Maps
What are the colored bands along the coastline?
The colored and patterned bands represent the classification of the bluff face and the shoreline type at the base of the bluff (Figure 2). The colors indicate the relative stablility of the bluff face. Less stable bluff faces are more susceptible to erosion. Figure 3 shows generalized cross sections of the stability categories. The patterns show the type of shoreline at the foot of the bluff. The type of shoreline indicates the potential for erosion at the foot of the bluff. Erosion at the foot of the bluff will often accelerate erosion on the bluff face itself. Shorelines consisting of ledge have little potential for short-term erosion. Erosion potential increases for types ranging from armored to salt marsh to beach/flat. Images of the categories are shown on the map sidebar (pdf). Full descriptions of the colors are given in the map explanation (pdf).
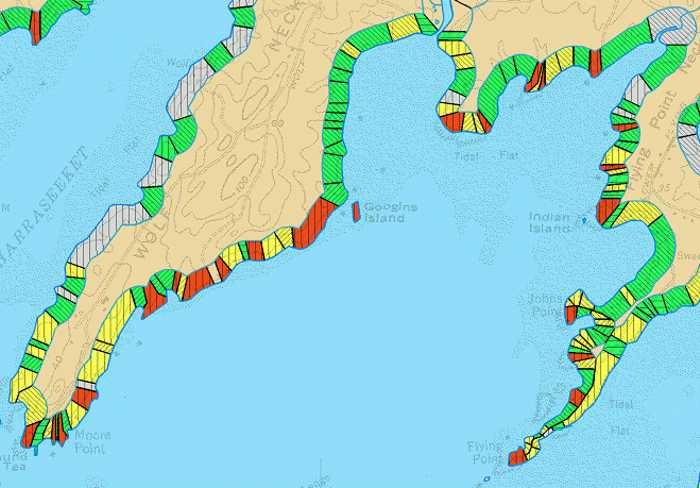
Figure 2. Colored bands shown on Coastal Bluffs Maps. Colors show the stability of the bluff (Figure 3) and patterns show the shoreline type. For a more complete description, refer to the map explanation (pdf) and map sidebar (pdf).
Figure 3. Cross sections showing stability categories of coastal bluffs. Definitions of categories are as follows:
|
Does the width of the colored band have meaning?
The width of the colored band is for illustration purposes only -- it DOES NOT indicate the width of the erosion stability area. The actual width of the bluff face is much narrower.
How accurate are the unit boundaries?
This map is intended to provide only general information on the overall stability of bluffs. It is not intended to be the sole basis upon which specific land-use decisions are made. The information portrayed on this map is based on visual inspection of the coast from offshore, and parts of the shoreline may have changed slightly since the field work was completed. Because of the map scale, shoreline characteristics are generalized into 150-foot segments. It is important to realize that the bluff classification only shows the average stability inferred for each section of the shoreline, and some shores mapped as stable may contain small areas that are unstable. Figure 4 shows a bluff which is too small to appear on the map. This bluff exhibits the characteristics of an unstable bluff: curved tree trunks, exposed roots, and bare ground on a steep slope. It is an area to be concerned about on a local scale. For an evaluation of site-specific shoreline erosion risks and landslide potential, you should contact a certified geologist or geotechnical engineer.
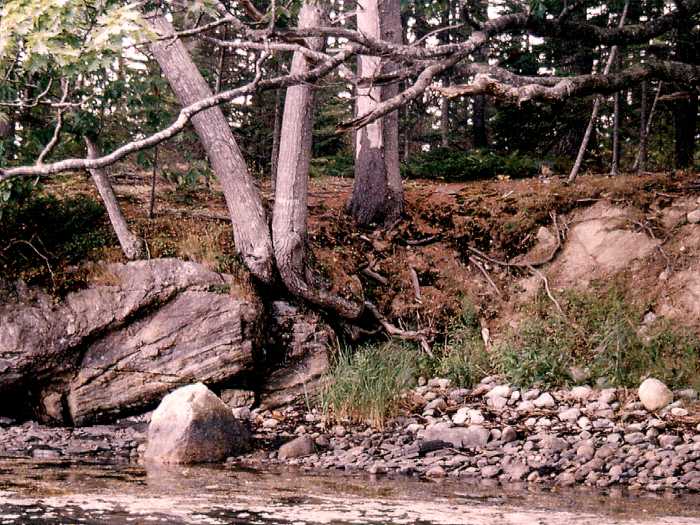
Figure 4. Coastal bluffs maps are regional maps, and as a result, some shores mapped as stable may contain small areas that are unstable. A bluff, too small to appear on the map, is shown in the photo. This bluff exhibits the characteristics of an unstable bluff: curved tree trunks, exposed roots, and bare ground on a steep slope. It is an area to be concerned about on a local scale. However, this degree of detail is not shown on the coastal bluff map.
Is it possible for the classification to change over time?
The colored categories correspond to field conditions when the map was made. Spot checks of map units have been found to be constant for up to a decade (since the first shorelines were first mapped.) Conditions in some areas may have changed in the last few years. Comparison of the information on this map with current conditions on the coast may indicate that a stability category is different now. Since bluff erosion may be cyclical, the change may only be temporary. If coastal development is near any bluff we recommend a professional evaluation be made to determine the risk to structures or new development. It is important when using a coastal bluffs map to use the most recent edition available (Figure 5). The most recent edition is available in the online maps section of the MGS website.
Figure 5. Title block from a Coastal Bluffs Map. Note date and open-file number in lower right.
The north shore of Rockland is an example of where the classification has changed over time. A landslide in 1996 resulted in a significant loss of land on and above a coastal bluff. Subsequent grading of the land and construction of riprap engineering along some parts of the shore altered the coastal bluff to make it more stable so a map change along part of the shore is in order (Figure 6a. A portion of the Rockland Coastal Bluffs map showing the landslide area. Figure 6b. Aerial photo of the landslide. Figure 6c. The landslide area after remediation.).
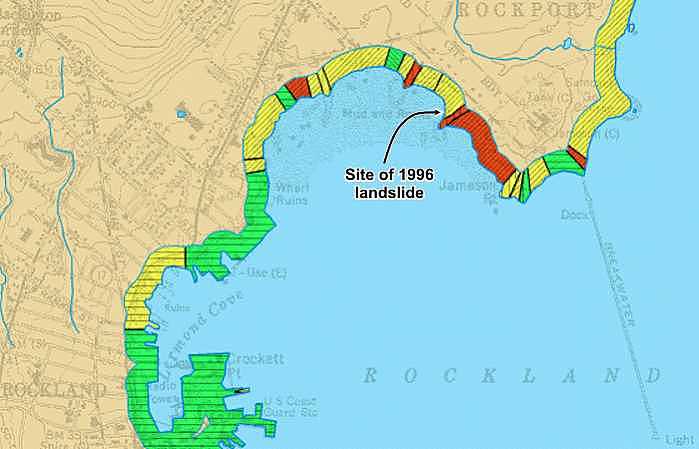
Figure 6a. A portion of the Rockland Coastal Bluffs map showing the area landslide of the 1996 landslide.
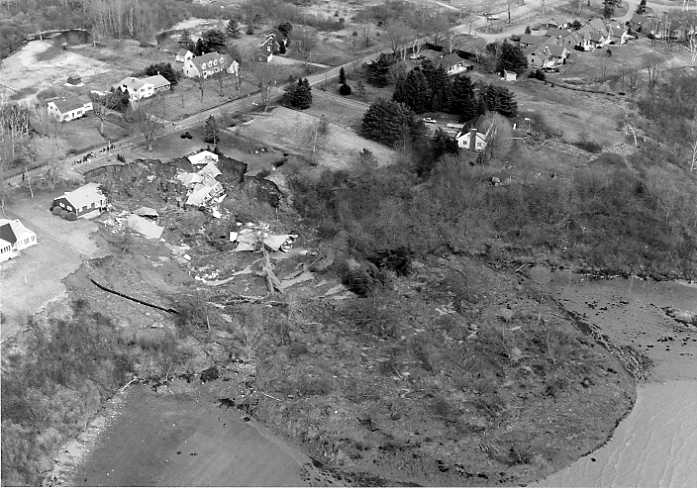
Figure 6b. Aerial photo of the 1996 Rockland landslide.
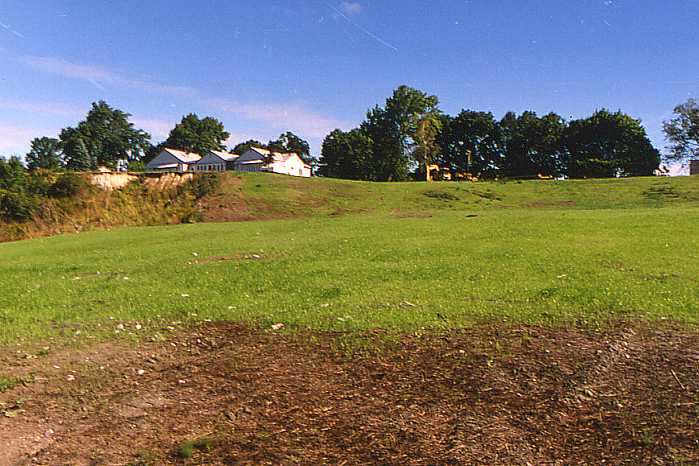
Figure 6c. The Rockland landslide area after remediation.
For more information on the Rockland landslide, see The April 1996 Rockland Landslide, and Aftermath of the 1996 Rockland Landslide.
Are landslide areas shown on the map?
Coastal bluffs maps describe the processes and stability of the face of a bluff (see Figure 1). A companion map, coastal landslide hazards, describes the internal stability of sediment bluffs and their potential to rapidly move large amounts of land downslope under the influence of gravity. In general, landslide-prone bluffs have (a) high and steep faces, (b) clay sediment, (c) erosion near the high-tide line, and (d) a high ground-water table. As with processes on the bluff face, landslide movement is episodic. A 1996 landslide in Rockland Harbor (Figure 7) occurred in an area where the bluff face is classified as unstable. In addition, the bluff had all the characteristics (a-d) listed above. This fact emphasizes that the coastal bluffs map does not indicate sites with a potential for catastrophic landslides. Additional factors need to be considered beyond the appearance of the bluff face and type of shoreline below the bluff. To determine the risk of a landslide, a site-specific study of the geology and strength characteristics of the bluff should be made by certified geologists or geotechnical engineers.

Figure 7. A clay bluff on the north shore of Rockland Harbor failed in 1996. This landslide formed a new scarp about 200 feet landward of the original top of the bluff in just a few hours. Two homes were destroyed as a result of this catastrophic slide.
What can you use the statistics table for?
Every bluff map has a table showing the length of bluff types in each municipality on the map. The statistics summarize which map unit (e.g. unstable bluff) is most common - at least for the part of a municipality shown on the map. Combining the numbers from adjacent maps (if necessary), will lead to statistics for a full municipality. In many locations, not every mile of a municipality's shoreline is mapped. Unmapped areas are illustrated on the coastal bluffs map so it is possible to know the region over which the statistics were generated.
The sum of bluff shorelines over an entire county can help in regional planning and county emergency management plans. For regional coastal management, statistics on bluff shorelines may be of use in guiding land use and development.
Statistics from this map series indicate that about half of the Maine coast has bluffs along the shoreline. This finding is rather contrary to the commonly held notion that the coast is rocky and resistant to erosion.
What's the best way to use this map when looking at coastal property?
This map can be helpful when evaluating coastal property for development or purchase. Since unstable and highly unstable bluffs are likely to be eroding, land loss may put a building at risk at some time in the future. Some bluffs may erode a foot per year (on average), so a building only 50 feet landward of the top of a bluff might be at risk in 50 years if erosion continued at the historical rate.
If a building is or might be at risk in the future from bluff erosion, the structure might need to be relocated landward in the future. Alternatively, if a bluff face is altered to reduce the rate of land loss (perhaps by lowering the slope and vegetating it), then the risk to a structure might be reduced.
The map also indicates segments of the shoreline where coastal engineering has been built in the past. The presence of retaining walls or riprap suggests that a site has experienced erosion in the past. If the wall stopped erosion from a bluff, the intertidal zone may experience accelerated erosion and higher wave energy at the base of the structure. These physical changes from the engineering structure might lead to the need for recurring maintenance of a wall or riprap.
When looking at a coastal property, refer to the pictures in the map legend and review the processes that take place on and around coastal bluffs. On a site walk it may be possible to recognize characteristics of the bluff or land-use that indicate that the shoreline is still unstable or eroding.
Tips for Reading the Maps - Related Maps
How does the coastal bluffs map relate to a coastal landslide hazards map?
The coastal landslide hazards map and the coastal bluffs maps are companions. They each show a different aspect of the shoreline. The coastal bluffs map describes what happens on the face of a bluff and indicates how stable the bluff is with a simple color pattern of red, yellow, and green. The coastal bluffs map also shows what the shoreline at the high tide line is composed of (rock, armor, marsh, or beach). Each of these shoreline types also can be used to understand the nature of the bluff above the high-tide line.
The coastal landslide hazards map is based, in part, on the presence of a coastal bluff. A high bluff is a necessary condition for a site to be landslide-prone. There are, however, some coastal lowlands without bluffs immediately along the shoreline that were former landslide sites. In essence, the landslide removed the bluff that was once rising from the high-tide line and the slumped earth materials now form a non-bluff shoreline. There may still be a landslide scarp or bluff some distance inland at such a location, but the landslide would not show up on a coastal bluffs map because a bluff is no longer immediately along the shoreline (it is now perched above the slide blocks). Where these relict landslides are known, they are shown on the coastal landslides hazard map.
How does the coastal bluffs map relate to a surficial geology map?
Coastal bluffs always occur in sedimentary deposits. These deposits are shown on a surficial geology map. Coastal bluffs can be found in all types of surficial deposits including the glaciomarine Presumpscot Formation (silt and clay), glacial outwash sand, glacial till (sand and gravel) and other surficial units on a surficial geology map. Glacial tills are generally more resistant to erosion than fine sand or the Presumpscot Formation, so the combination of maps can provide a more complete picture of where bluffs are and what they are made of.
More Information
For more information on Maine's coastal bluffs, refer to the following pages:
For further assistance in interpreting this map, contact a geologist at the Maine Geological Survey.
Last updated on April 26, 2012